As educational freedom and school choice have spread in recent years, it’s become clear that not all programs are created equal. But how to rank them is tricky. Many organizations, including Cato, the Heritage Foundation, and ALEC, have education freedom indices that incorporate a variety of metrics.
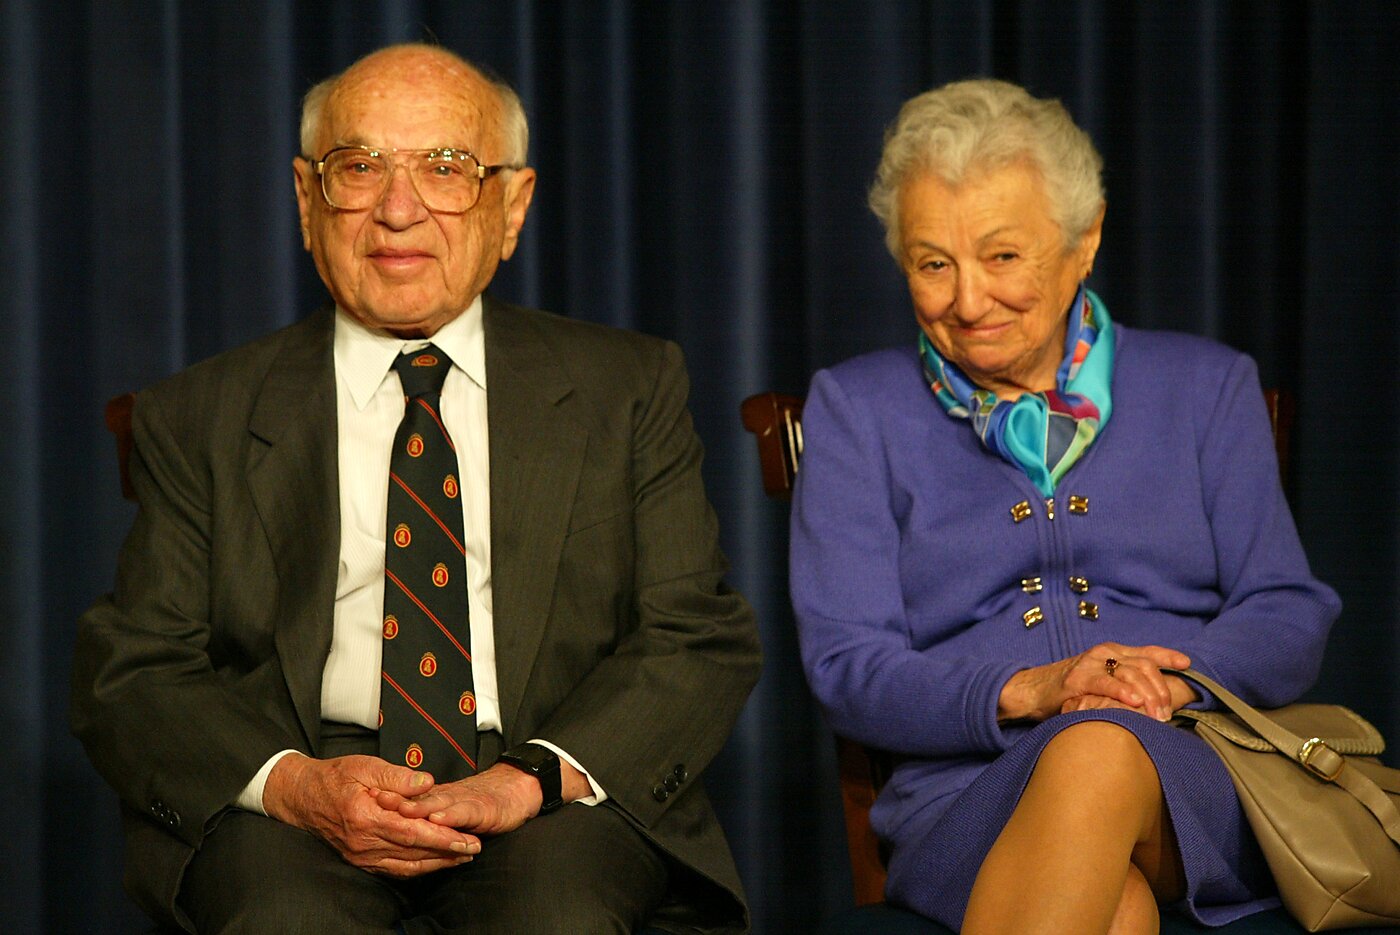
The latest—and simplest—ranking was released last month: the EdChoice Friedman Index. It’s named after the late Nobel Prize-winning economist Milton Friedman, founder of EdChoice (originally called the Milton and Rose D. Friedman Foundation for Educational Choice), who is generally considered the father of the modern school choice movement. It looks exclusively at private school choice, whereas others include things such as charter schools, homeschool regulations, and teacher freedom.
In recent years, there has been tremendous growth in the availability of educational choice programs that allow funding to follow students to educational options beyond their residentially assigned public school. These include vouchers and tax credit scholarships that can be used for private school tuition, education savings accounts, and personal use tax credits that can be used for a variety of educational expenses.
Early programs were targeted to specific groups, such as students with special needs, kids who had been assigned to poor-performing schools, and students from low-income families. In 2021, West Virginia created the Hope Scholarship, an ESA that’s open to almost any student in the state, and Arizona expanded its ESA to universal eligibility the following year. Since then, states are increasingly creating programs that—on paper at least—include universal eligibility. In reality, these programs often have insufficient funding, so thousands of students end up on waitlists even if they’re technically eligible.
That’s where the Friedman Index comes in. “We wanted to create the Index as a tool for policymakers and advocates to get a better, more accurate understanding of how much educational freedom each state has,” says Ben Scafidi, professor of economics and director of the Education Economics Center at Kennesaw State University, who helped create the index. “EdChoice supported our effort because they were in the process of creating a new vision for the education choice movement: ‘All Students, All Options, All Dollars.’ Their new vision and our new Index aligned perfectly.”
Scoring for the Index is based on how well states meet each of those goals, so it evaluates student eligibility based on the percentage of children who are eligible to participate in school choice programs; spending flexibility—if parents can use funds not only for private school tuition but also for other educational expenses such as tutoring, textbooks, and special needs therapies; and funding parity, comparing per-pupil funding at public schools with how much funding choice students receive.
“The components of the EdChoice Friedman Index show very clearly what each state needs to do to increase their score,” explains Colyn Ritter, senior research associate at EdChoice and co-creator of the Index. “Take Utah for example—Friedman Index score of 1 out of 100. Our index makes it clear that their low score is due to the fact that, despite having a ‘universal’ ESA program, funding only exists for roughly 10,000 students, or 2 percent of the UT K‑12 population, to participate. So their ‘All Students’ component of the Index is a 2. To increase their score, and increase education choice for families, the Beehive State needs to provide more funding so that more families may actually access choice opportunities.”
According to Ben, they’re hoping the Index provides clarity for lawmakers and policy researchers who are designing programs. “The index outlines clearly how much educational freedom is present in each state, but more importantly, it shows states how they can maximize educational freedom in their state,” he adds.
Although the Friedman Index is new, there are signs it will have the desired impact. “We’ve received great feedback so far,” Colyn says. “For example, someone in the education freedom movement in Montana reached out to us to say their hope was that Montana’s low score in the index would motivate policymakers in Montana to push for more expansive choice programs that would benefit Montana families. Advocates in many other states have told us they would use their Friedman Index scores to motivate their states to increase choice as well.”


